Is Bitcoin a Safe Haven? Part 2
Exploring the Volatility of Bitcoin

Introduction
In recent years, cryptocurrencies, most notably Bitcoin, grew in popularity, and
investors have become increasingly concerned about its possible impact on other
asset classes due to its extreme volatility. Understanding the mechanisms of
volatility spillover1 between Bitcoin and traditional assets is critical for investors
looking to diversify and manage their risks.
The volatility of Bitcoin and other cryptocurrencies has been analyzed by
economists and scholars, who have compared it to that of traditional assets. To
determine if Bitcoin’s volatility affects traditional assets and to capture the com-
plexities of volatility spillover dynamics, researchers have used various methods
to investigate market contagion effects.
Several studies have investigated the market contagion effects of cryptocur-
rencies, including Bitcoin, and traditional assets using methods such as GARCH,
wavelet analysis, and DCC-GARCH. Kumar and Suvvari (2019)[KS19] and
Ozdemir (2022)[O18] found evidence of volatility spillover risks among cryp-
tocurrencies, which increased during moments of heightened market uncertainty
and the COVID-19 pandemic era. Other studies have investigated the market
contagion effects of stock and currency rate volatility in oil-exporting countries,
discovering significant volatility spillover impact between stock and exchange rate markets (Mikhaylov, 2018[Mik18]) and considerable spillover effects be-
tween financial markets, including stocks, bonds, and currency rates, especially
during times of financial crisis (Xiong and Han, 2015[Xio15]).
In Guz and Isabetli Fidan’s (2022) study, asymmetric volatility and lever-
age effects were found in five cryptocurrencies, including Bitcoin, driven by
market circumstances such as trade volume and liquidity. Kumar and Ajaz
(2019)[KS19] found substantial co-movement between many cryptocurrencies,
including Bitcoin, using wavelet analysis. Chi and Has (2020)[CH20] discovered
that the GARCH model was the best for predicting Bitcoin volatility using data
from spot and option markets.
This study aims to investigate the volatility spillover effects between Bitcoin
and traditional assets using various methodologies to capture the complexity
of the dynamics. We will assess the hedging effectiveness using Ederington’s
(1979)[Ede79] methodology and implement the hedge ratios technique proposed
by Kroner and Sultan (1993)[KS93] to optimize the allocation of assets in the
portfolio to minimize risk. Finally, we will analyze the statistics of the hedging
effectiveness measure using the methodology proposed by Antonakakis et al.
(2020)[ACG20] to provide insight into the investment strategies and hedging
effectiveness of the portfolio.
In a previous article in this series, we sought to answer the question ”Is
Bitcoin a Safe Haven?”2 by examining the connectedness relationships between
Bitcoin and traditional assets. The study was conducted over the period of 2017-
2022 and found that Bitcoin was becoming increasingly influenced by other
variables such as the NASDAQ Composite Index, the US Dollar Index, and
the CBOE Volatility Index. Our analysis of Bitcoin’s effect on these variables
during its peak period of 2020-2021 led us to question the link between Bitcoin’s
volatility or risk and these variables. As a result, we concluded that Bitcoin
cannot be considered a diversification or safety agent in relation to the assets
evaluated in this study.
The previous study highlighted the importance of understanding the volatil-
ity spillover effects between Bitcoin and traditional assets. In this current study,
we aim to investigate these effects further by using various methodologies to
capture the complexity of the dynamics.
Overall, this research will be useful for investors in understanding the risk
and diversification benefits of adding Bitcoin to their portfolios and the potential
risks and uncertainties associated with these assets. The findings suggest that
volatility transmission effects can vary depending on market conditions and
events.
Empirical methodology
We aim to capture the complexities of cross-market volatility dynamics using
various methodologies. We begin by using the Dynamic Total Connectedness
analysis technique, which allows us to assess the degree of connectedness between
assets in the system. This method helps us to identify which assets play a critical role in transmitting shocks across the network.
We also use the Net Total Directional Connectedness measure (N ETi), which
provides insight into the net effect of a given asset on the network. A positive
value indicates that the asset is a net shock transmitter, while a negative value
suggests that it is a net shock receiver.
Additionally, we employ the Net Pairwise Directional Connectedness mea-
sure (N P SOij ), which allows us to assess whether one asset has a larger impact
on another asset than the other way around. This method helps us to identify
the directionality of the transmission of shocks across the network.
The DCC-GARCH model enables us to examine the total connectedness
index (T CI), which is separated into total directional connectivity ”textitTO
others” and ”textitFROM others”. We may estimate the degree of interconnec-
tivity between assets in the system by studying the T CI. Moreover, we will
re-plot the total connectedness index (T CI), total directional connectivity ”TO
others” and ”FROM others,” and net total directional connectivity (N ET i).
Additionally, we use the network diagrams to visualize the relationships
between assets in the system. The network plots display the NPDC and the
Percentage Change in Connectivity (PCI), which help us to identify changes in
the relationships between assets over time. We also use the net influence index
(INF), which emphasizes percentage changes in the relationships between assets
rather than levels.
To further our understanding, we use the Multivariate Portfolios technique,
which helps us to identify a minimum connectedness portfolio. This technique
allows us to construct portfolios that are optimized for risk management by
minimizing the transmission of shocks across the network. We also look at the
Cumulative Returns of Minimal Connectedness Portfolio, which provides insight
into the performance of the portfolio over time.
We assess the effectiveness of hedging by comparing the returns of a hedged
portfolio to an unhedged portfolio. We also use the hedge ratios technique to
optimize the allocation of assets in the portfolio and minimize risk.
Finally, we analyze the statistics of the hedging effectiveness measure using
a methodology that provides insight into the investment strategies and effec-
tiveness of the portfolio’s hedging.
Data set and empirical results
Data Description
We conduct an analysis of implied volatility, more specifically on BTC price
volatility, as well as examining several other indices such as Dow, NAQ, precious
metals (Gold ETF), currency pairs (DXY), crude oil prices (WTI), and market
volatility (VIX). The time series data utilized for this study encompasses the
period from 2017 to 2022, allowing us to observe the transformative trends in
Bitcoin over the last five years. This methodology not only sheds light on the
dynamics of Bitcoin’s implied volatility but also unveils insights into the broader market landscape, emphasizing the interconnections among diverse asset classes.
The data in the sample is a time series of daily data from 2017 to 2022.This
time period spans the previous five years of Bitcoin variations, from its apparent
maturation to the recent explosion in activity and broad acceptance of the
”currency.”
Empirical Results

We begin by analyzing the Total Connectedness Index (TCI), which evalu-
ates the impact of all factors on the forecast error variance of a single variable
over time. The table displays the percentage connectedness impact between
different variables, with each row representing the impact one variable has on
another. The end column labeled ”TO” shows the impact of other variables
on a specific variable, while the end row labeled ”FROM” shows the impact
of a specific variable on other variables. The penultimate row, labeled ”NET,”
represents the difference between the TO and FROM columns, and the last row
labeled ”NPT” shows how many series a specific series dominates. This table
provides valuable information for analyzing the relationships between different
variables and their impacts on one another.
The results reveal that Bitcoin (BTC) has a minor or negligible effect on
the other series studied, and vice versa. The average influence of BTC on
the other variables in the series is approximately 15%. Additionally, the TCI
graph shows that BTC has an average influence of 20-30% on the other variables
analyzed, with a peak influence of 60% at the beginning of 2020 and an average of
around 30% between 2020 and 2021. This suggests that BTC may be somewhat
connected with other variables during certain periods, but its overall impact is
still relatively small.


We also examine the N ETi, which represents the difference in overall di-
rectional connectivity between the TO and FROM variables. The results show
that BTC is frequently a shock receiver, but primarily became a shock emitter
between 2020 and 2021. This means that during this period, BTC was more
likely to transmit shocks to other variables than to receive them.
Moreover, we look at the NPDT graphs, which illustrate the degree of pair-
wise directional predictability between variables. We notice a sharp increase in
the NAQ-BTC graph starting in 2020, making NAQ the asset with the most connection to BTC. We also notice some connections between BTC and VIX,
but with a negative correlation. Unlike the previous graph, we see a peak in
2018 that quickly decreases and then another peak in 2020 until the end of our
studied timeline. We also observe a similar trend in the GOLD-BTC graph,
with the peak starting in 2020 and quickly decreasing. However, we do see a
slight increase, or rather a new formation of a peak, at the end of our studied
period.
Upon initial examination, there appears to be no indication of any significant
relationship between BTC and the other variables studied. However, a closer
examination reveals a modest connection between BTC and the other factors,
with a peak in connectedness observed between 2020 and 2021. This period is
particularly noteworthy, as it marked a time of increased usage and interest in
BTC since its creation. This theme is recurrent throughout the paper and will
be further explored in subsequent sections. We also noticed this similar trend
in the previous study.
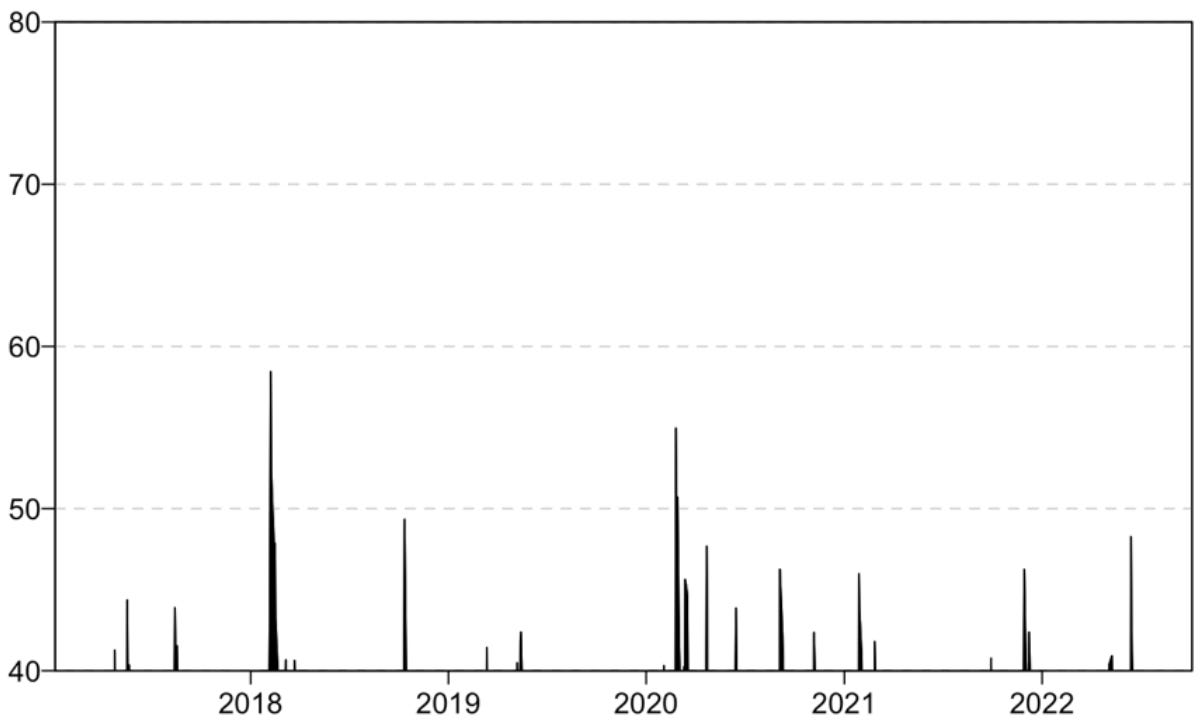
We proceed on to investigate the Total connectedness index (TCI), which
measures the average impact of all factors on the forecast error variation of a
single variable across time. We can see that there are two significant peaks: the
first occurs in 2018 and stays just under 60%, and the second occurs in 2020
and peaks at about 55%. We notice that the time period when we observe the
most spikes is between 2020-2021.

The difference in overall directional connection between TO and FROM
the other variables is represented by the NETi, which is the next step. The
findings indicate that whereas BTC was initially a shock emitter between 2020
and 2021, it is now largely a shock absorber. Similar patterns can be seen in
the TO and FROM graphs as well.

In order to identify which series has a higher or lower influence on the other,
the Net Pairwise Directional Connectedness Measure (NPDC) was used. The
findings indicate that connection increased most significantly between 2020 and
2021. Particularly, NAQ and BTC were found to have the most influence.
The graphs’ research also demonstrates that BTC had a negligible impact on
GOLD during the time period under consideration, reaching its highest influence
around 2020 before reverting to its earlier levels from 2021 until the present.
On the WTI and BTC graphs, we can see a similar peak, although the impact
is considerably less significant this time around.

We also assessed the network plots that showed the NPDC and PCI. The
two network diagrams don’t clearly or strongly depict any relationships between
BTC and the other factors studied.
Multivariate Portfolio Analysis
We delve into the analysis of multivariate portfolios, incorporating BTC and
other variables in our study, with a nuanced analysis catering to three distinct
investor risk profiles. Tables provide essential metrics such as the mean, rep-
resenting the average value over a given period, and the standard deviation,
elucidating variability around the mean.
Commencing with the minimum variance portfolio, tailored for risk-averse in-
vestors, we note GOLD commanding the largest share at 55%, followed by NAQ
and DXY at 20% and 19%. DOW and WTI contribute negligibly, and notably,
BTC is conspicuously absent.

Transitioning to the minimum correlation portfolio, crafted for those vigilant
about correlation, BTC makes its entrance with a 14% allocation, ranking as
the fourth largest weight. DXY (26%), DOW (23%), and GOLD (16%) take
the lead, while WTI and NAQ closely follow with 12% and 9%, respectively.

Finally, delving into the minimum connectedness portfolio for investors con-
cerned about network stability, BTC claims the highest percentage at 17%,
surpassing GOLD and WTI at 18%, while the remaining variables stand at
16%. Graphs vividly illustrate BTC’s pivotal role in network stability, with the
minimum connectivity score consistently higher.

Examining cumulative returns, we find that portfolios incorporating BTC
outperform those without. Notably, the minimum connectedness portfolio ex-
hibits superior performance, followed by the minimum correlation portfolio and
the minimum variance portfolio.
Moreover, our study delves into statistical nuances, exploring the signifi-
cance level (”5%”) and confidence level (”95%”) crucial in statistical hypothesis
testing. We emphasize the importance of these levels in understanding the
probability of rejecting null hypotheses and constructing confidence intervals.
HE, denoting Hedge Effectiveness, is elucidated, and the p-value is high-
lighted for its significance in assessing the statistical significance of the relation-
ship between analyzed variables.

From the graphs, we can see that BTC is the asset that will be most crucial
for preserving the stability of the entire network because it has the highest
minimum connectivity score. The MCP averages around 0.2 with a drop towards
0 between 2020 and 2021, while the MVP for bitcoin is consistently close to 0.
Lastly, we see that the MCoP averages around 0.2 throughout, with a few minor
variations. The MCP, MVP, and MCop are plotted on the cumulative return
graph next. The 3 remained largely below 1 until 2021, when MCoP barely
breached it before restarting the decline at the end of our time period.
These results indicate that if BTC were to experience a shock or disruption,
it could have a significant impact on the entire cryptocurrency market. On
the other hand, assets with lower minimum connectedness scores may be less
important for overall network stability.

Looking at the minimum of the three portfolios discussed above, we can see
that the MCoP portfolio is the most performant, followed by MCP and finally
MVP. This indicates that portfolios that included BTC outperformed those that
did not.

Finally, we will look at the cumulative return graphs, which depict an invest-
ment’s performance while accounting for both capital gains (or losses) and the
reinvested dividends or other payments that were received during the time pe-
riod. Globally, we see that, with the exception of BTC-GOLD and BTC-WTI,
portfolio pairs containing Bitcoin performed significantly better than other port-
folio pairs. We also notice that the graphs that demonstrate better performance
have very similar graphs with the same peaks along the timeline.
Conclusion
This study investigates the volatility spillover effects of Bitcoin and traditional
assets using a variety of methodologies. Its findings can help investors and reg-
ulators understand the diversification benefits and risks associated with adding
Bitcoin to their portfolios. To capture the complexities of volatility spillover
dynamics, the study employs methodologies such as Dynamic Total Connect-
edness analysis, Net Total Directional Connectedness, Multivariate Portfolios,
and DCC-GARCH models. The findings indicate that while BTC may be con-
nected to other variables at times, its overall impact remains small. Regarding
BTC’s role in investor portfolios, portfolios containing around 15.5% BTC gen-
erally outperformed portfolios containing no BTC. Overall, this study provides
useful insights into the relationships between BTC and the various variables
investigated, as well as their effects on one another.
References
[Ede79] Louis H Ederington. “The Hedging Performance of the New Futures
Markets”. In: Journal of Finance 34 (1979).
[KS93] Kenneth F. Kroner and Jahangir Sultan. “Time-Varying Distribu-
tions and Dynamic Hedging with Foreign Currency Futures”. In:
Journal of Financial and Quantitative Analysis 28 (1993).
[Xio15] Han L. Xiong Z. “Volatility spillover effect between financial markets:
evidence since the reform of the RMB exchange rate mechanism”. In:
Financial Innovation 1 9 (2015).
[Mik18] Alexey Mikhaylov. “Volatility Spillover Effect between Stock and Ex-
change Rate in Oil Exporting Countries”. In: International Journal
of Energy Economics and Policy 8 (2018).
[O18] ̈Ozdemir O. “ue the volatility spillover in the cryptocurrency markets
during the COVID-19 pandemic: evidence from DCC-GARCH and
wavelet analysis”. In: Financial Innovation 8 12 (2018). doi: https:
//doi.org/10.1186/s40854-021-00319-0.
[KS19] Anoop Kumar and Anandarao Suvvari. “Volatility spillover in crypto-
currency markets: Some evidences from GARCH and wavelet anal-
ysis”. In: Physica A: Statistical Mechanics and its Applications 524
(2019). doi: 10.1016/j.physa.2019.04.154.
[ACG20] Nikolaos Antonakakis, Ioannis Chatziantoniou, and David Gabauer.
“Refined Measures of Dynamic Connectedness based on Time-Varying
Parameter Vector Autoregressions”. In: Journal of Risk and Finan-
cial Management 13 (2020). doi: 10.3390/jrfm13040084.
[CH20] Yeguang Chi and Wenyan Hao. “A Horserace of Volatility Models for
Cryptocurrency: Evidence from Bitcoin Spot and Option Markets*”.
In: (2020).
Volatility spillover: the transfer of instability from one market to another. It occurs when
a change in volatility price in one market has a delayed impact on volatility price in another
market that is greater than the local market effects.
Is Bitcoin a Safe Haven?

Introduction In recent years, the cryptocurrency industry has experienced significant growth and increased sophistication. Despite the financial crisis of 2022, the market capitalization of Bitcoin remains high, four times that of 2020. This growth has