Is Bitcoin a Safe Haven?
Exploring the Interconnectedness of Bitcoin

Introduction
In recent years, the cryptocurrency industry has experienced significant growth
and increased sophistication1. Despite the financial crisis of 20222, the market
capitalization of Bitcoin remains high, four times that of 20203. This growth has
led researchers to examine the spillover4 effects between Bitcoin and traditional
financial markets.
Several studies have explored the relationship between Bitcoin and other
asset classes. Henriques and Sadorsky (2018) [HS18] used GARCH models to
find that replacing Gold with Bitcoin in an investment portfolio would benefit
even risk-averse investors. Urquhart (2018)[Urq18] found a relationship between
investor attention to Bitcoin and its volatility and volume. Lyer (2022) [Iye22]
found an approximate 14-18% spillover between Bitcoin and the global equity
markets. Risk spillover between Bitcoin and the traditional financial market
was also detected in Zhang et al.(2021)[Zha+21]. Similar results were also seen
in Qarni et al.(2019)[Qar+19] which studied this relationship exclusively related
to the US stock market.
Previous studies, such as Bouri et al. (2017)[Bou+17], found that Bitcoin
can function as an impact hedge and a safe haven against fluctuations in en-
ergy commodity indices, but not against non-energy commodities. Selmi et al.
(2018) [Men+18] found that Bitcoin operates as a hedge, safe haven and di-
versifier against the volatility of oil prices, similar to Gold. Moreover, Corbet
et al. (2018) [Cor+18] suggested that Bitcoin is largely unaffected by tradi-
tional financial assets, but may provide diversification benefits for short-term
investors.
The present study focuses on evaluating the level of interconnection and
potential for spillovers between Bitcoin and other asset classes. As a result, we
investigate the following questions:
How strong are the spillovers between Bitcoin and other asset classes, and
have they increased over time?How correlated are movements between Bitcoin and traditional markets?
Has this correlation changed over time?Can Bitcoin provide diversification benefits to traditional investors?
Empirical Methodology
We implement the Generalized Vector Autoregressive connectedness approach
based on Diebold and Yilmaz (2012)[DY12], which builds on Sims’ (1980)
Vector Autoregressions and Pesaran and Shin’s (1998)[Sim80] and Koop et
al’s (1996)[KPP96] generalized prediction error variance decompositions. This
method evaluates the dynamic links between multiple variables by first ”shock-
ing” one variable and observing the response of all other variables.
The effects of a shock in variable i are then accumulated and subtracted from
the shocks in variable −i. This results in the net directional connectedness
illustrating the influence that variable i has on the other assets. That is, if
variable i is influencing other variables more than is being influenced by them,
it is driving the market, while the opposite means that it is driven by the
market. However, such an analysis will mask the influence across pairs of assets.
Therefore, we compute the net pairwise directional connectedness that provides
additional insights into the intra-asset patterns. Last but not least, the dynamic
connectedness relationships can be traced over time via rolling window VAR
estimation.
To demonstrate the average impact of a shock in one series on others, we use
the total connectedness index (T CI), which is divided into the total directional
connectivity ”TO others” and ”FROM others”. The net total directional con-
nectedness (N ETi) depicts the net effect on the network, with a positive value
indicating that series i is a net shock transmitter and a negative value indicating
it is a net shock receiver.
To gauge the shock levels, we resort to the net pairwise directional con-
nectedness measure (N P SOij ), which states if series i has a larger (or smaller)
impact on series j than series j has on series i. To determine the extent of
domination of each series, we use the net pairwise transmission plot and the net
influence index.
We are interested in finding out the level of domination for each series. To
do this, we use the Net Pairwise Transmission (N P T ) plot which shows how
many series each series i dominates. In a network with k series, one series
can dominate a maximum of k − 1 series. The N P T plot summarizes the net
transmission mechanism of each series.
In addition, we use the Net Influence Index, which is similar to the Net Pair-
wise Directional Connectedness (N P DC) plot but shows changes in percentage
rather than levels.
Lastly, we use Network plots which show the NPDC and the Percentage
Change in Connectivity (PCI). These plots give us a visual representation of the
relationships between assets, displayed as arrows on the chart. We also look at
the net influence index (INF), which is equivalent to the net pairwise directional
connectedness plots, emphasizes percentage changes rather than levels.
Dataset and Empirical Results
Data Description
In this study, we investigate the implied connectedness of the return of Bitcoin
(BTC) with respect to six other financial indices that are classified into three
asset classes: equities, precious metals and foreign exchange rates. The BTC
return connectedness is the primary variable of interest in this analysis. As
proxies for the stock market returns, we utilize the Dow Jones Industrial Av-
erage (DOW) and the NASDAQ (NAQ) composite index. The volatility in the
stock market is represented by the CBOE Volatility Index (VIX). The foreign
exchange rates are represented by the U.S. Dollar Index (DXY), which is an
index of the value of the United States dollar relative to a basket of foreign
currencies. The Gold index (GOLD) serves as a proxy for the precious metals
asset class, and West Texas Intermediate (WTI) represents the commodities
asset class.
The sample data in this study comprises of daily time-series data from 2017
to 2022, which spans a five-year period and includes Bitcoin variations over that
time. This period extends from the perceived maturity of Bitcoin to its recent
surge in popularity and increased adoption as a digital currency.
Empirical Results
We initially analyze the Total connectedness index (TCI), which evaluates the
average impact of all factors on the forecast error variance of a single variable
over time. The table displays the percent connectedness impact between dif-
ferent variables. Each row represents the impact one variable has on another,
and the end column labeled ”TO” shows the impact of the other variables to a
specific variable. The end row labeled ”FROM” shows the impact of a specific
variable on the other variables. The previous last row, labeled ”NET,” repre-
sents the difference between the TO and FROM columns. Finally, the last row
labeled ”NPT” shows how many series a specific series dominates. The table
provides valuable information for analyzing the relationships between different
variables and their impacts on one another.


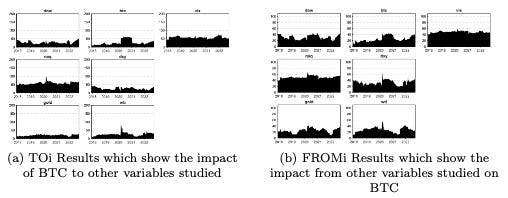
The results reveal that BTC has a minor or negligible effect on the other
series studied, and vice versa. The average influence of BTC on the other
variables in the series is approximately 25%. Additionally, (T Oi) graphs show
that BTC has an average influence of 30-40% on the other variables analyzed,
with a peak influence of 50% between 2020 and 2021. We also evaluate the
(F ROMi) graphs, which reveal that other series have a sizable impact on BTC,
with a peak influence of 40% between 2020 and 2021. Finally, we examine
the N ETi, which represents the difference in overall directional connectivity
between TO and FROM the other variables. The results show that BTC is
frequently a shock receiver, but primarily became a shock emitter between 2020
and 2021.

Upon initial examination, there appears to be no indication of any significant
relationship between BTC and the other variables studied. However, a closer
examination reveals a modest connection between BTC and the other factors,
with a peak in connectedness observed between 2020 and 2021. This period is
particularly noteworthy, as it marked a time of increased usage and interest in
BTC since its creation. This theme is recurrent throughout the paper and will
be further explored in subsequent sections.
Next, we analyze the Net Pairwise Directional Connectedness Measure (N P SO)
to determine which series has a greater or lesser impact on the other. We exam-
ine the NPS0ij between BTC and the other six variables. The results show that
the majority of the growth in connectedness occurred between 2020 and 2021.
Notably, the greatest influence was observed between NAQ and BTC, with an
average influence of -20 between 2020 and 2021. The analysis of the graphs fur-
ther reveals that BTC had a modest impact on DXY over the analyzed period,
with a peak influence observed around 2020 before returning to previous levels
from 2021 to the present.
These findings support the hypothesis that the most significant connections
are identified between NAQ and BTC, with a weaker relationship between BTC
and DXY.

The pairwise directional connectedness plots demonstrate a recurring pattern
in the relationship between DXY-BTC and NAQ-BTC. However, a stronger
association between DOW-BTC is observed. The analysis of the plots reveals a
noticeable and substantial peak between 2020 and 2021.
The net pairwise directional transmission plots determine the number of
series dominated by the BTC series. Our focus was on the BTC graph. The
results showed that the Bitcoin series dominated two series at its minimum and
six series at its maximum point in early 2021. The graph exhibited a peak trend
during the period of 2020-2021 and had the highest average number of series
dominated during this time frame.

The net influence index (INF) was also analyzed to examine the percentage
changes between the variables. The average change between the DOW and BTC
was approximately 40%, with the highest change observed at the start of 2019
reaching over 80%. The average change between NAQ and BTC was lower than
the DOW-BTC pairing, but still reached a peak of approximately 60% in 2019
and had its largest change at 80% at the start of 2020. The GOLD-BTC pair
showed a significant peak of about 80% change at the start of the observation
period, which was re-observed towards the end of the period at slightly above
80%. A comparable peak of 80% change was observed for BTC-DXY at the
start of the observation period, but the overall average change was substantially
higher than for all other pairings investigated. Regarding BTC-WTI, a low was
observed between 2020 and 2021, but the biggest peak, near the end of 2021,
was still about 80%. Finally, for BTC-VIX, a falling trend was observed starting
in 2020 and continuing into 2022, with a lower percentage change than in prior
variable graphs. The largest points of change were observed between 2019 and
2020.

The Pairwise Connectedness Index (PCI) was also analyzed in the study.
The PCI graph was constructed to represent the bilateral relationship between
BTC and the other six variables. The results revealed a modest impact between
BTC-DXY and BTC-WTI. These relationships displayed a peak impact between
2020 and 2021. Similar impact maxima were also observed in the relationship
between BTC-VIX and NAQ-BTC. The impact of NAQ-BTC had a higher
magnitude and remained elevated compared to the pre-peak levels, reaching a
peak probability of 60% in 2022. On the other hand, the relationship between
BTC and GOLD and the Dow had less than 20% influence. These relationships
displayed a slight peak impact between 2020 and 2021, but returned to levels
lower than the pre-peak.

In our final stage of analysis, we evaluated the network plots, which depicted
the NPDC and PCI. The first network figure, the NPDC, revealed a narrow con-
nection from VIX to BTC, indicating a moderate level of connectivity between
the two. However, two wider connections were observed from BTC to DXY and
GOLD, indicating a stronger relationship between these variables and BTC. In
the PCI network diagram, a thin line between BTC and NAQ suggests a weak
connection between the two.
Based on the net pairwise transmission plot and network plots, it can be
concluded that BTC was formerly connected to all six variables under consider-
ation. Upon further examination, we found that the strongest connections were
with DXY, GOLD and VIX.
Conclusion
The results of our analysis over the period of 2017-2022 show that Bitcoin is
becoming increasingly influenced by other variables such as the NASDAQ Com-
posite Index, the US Dollar Index and the CBOE Volatility Index. Our study of
Bitcoin’s effect on these variables during its peak period of 2020-2021 leads us
to question the link between Bitcoin’s volatility or risk and these variables. This
means that Bitcoin and the other assets listed before have a stronger link and
greater spillover than previously thought. As a result, we conclude that Bitcoin
cannot be considered a diversification or safety agent in relation to the assets
evaluated in this study. Further investigation of the volatility connectivity links
between these variables may result in the development of a well-constructed
portfolio. In future studies, we aim to provide a more comprehensive under-
standing of these connections.
References
[Sim80] Christopher Sims. “Macroeconomics and Reality”. In: Econometrica
48.1 (1980), pp. 1–48. doi: https://EconPapers.repec.org/RePEc:
ecm:emetrp:v:48:y:1980:i:1:p:1-48.[KPP96] Gary Koop, M.Hashem Pesaran, and Simon M. Potter. “Impulse
response analysis in nonlinear multivariate models”. In: Journal of
Econometrics 74.1 (1996), pp. 119–147. doi: https://doi.org/10.
1016/0304-4076(95)01753-4.[DY12] Francis X. Diebold and Kamil Yilmaz. “Better to give than to re-
ceive: Predictive directional measurement of volatility spillovers”.
In: International Journal of Forecasting 28.1 (2012), pp. 57–66. doi:
https://doi.org/10.1016/j.ijforecast.2011.02.006.[Bou+17] Elie Bouri et al. “On the hedge and safe haven properties of Bitcoin:
Is it really more than a diversifier?” In: Finance Research Letters
20 (2017). doi: 10.1016/j.frl.2016.09.025.[Cor+18] Shaen Corbet et al. “Exploring the dynamic relationships between
cryptocurrencies and other financial assets”. In: Economics Letters
165 (2018). doi: 10.1016/j.econlet.2018.01.004.[HS18] Irene Henriques and Perry Sadorsky. “Can Bitcoin Replace Gold in
an Investment Portfolio?” In: (2018). doi: 10.3390/jrfm11030048.[Men+18] Walid Mensi et al. “Is Bitcoin a hedge, a safe haven or a diversi-
fier for oil price movements? A comparison with gold”. In: Energy
Economics 74 (2018). doi: 10.1016/j.eneco.2018.07.007.[Urq18] Andrew Urquhart. “What causes the attention of Bitcoin?” In: Eco-
nomics Letters 166 (2018), pp. 40–44. doi: https://doi.org/10.1016/
j.econlet.2018.02.017.[Qar+19] Muhammad Qarni et al. “Inter-markets volatility spillover in U.S.
bitcoin and financial markets”. In: Journal of Business Economics
and Management 20 (2019), pp. 694–714. doi: 10.3846/jbem.2019.
8316.[Zha+21] Yue-Jun Zhang et al. “Risk spillover between Bitcoin and con-
ventional financial markets: An expectile-based approach”. In: The
North American Journal of Economics and Finance 55 (2021), p. 101296.
doi: https://doi.org/10.1016/j.najef.2020.101296.[Iye22] Tara Iyer. “Cryptic Connections: Spillovers between Crypto and Eq-
uity Markets”. In: International Monetary Fund (2022). doi: https:
//www.imf.org/en/Publications/global- financial- stability- notes/
Issues/2022/01/10/Cryptic-Connections-511776.
https://www.forbes.com/advisor/investing/cryptocurrency/crypto-market-outlook-forecast/
https://beincrypto.com/crypto-crash-2022-2008-financial-crisis-how-industry-turn-around/
https://coinmarketcap.com/charts/
A spillover in economics is a financial occurrence in one context that occurs as a result of
something else in a seemingly unrelated situation.