Atka Research: Article #1 - What variables influence Bitcoin’s price?
An analysis of Bitcoin’s price determinants
TL;DR Through this article, we hope to answer the questions surrounding Bitcoin price determinants and the nature of the factors that contribute to it.
1 Introduction
BTC has witnessed a massive adoption over the past two years1, which brought it to a market cap of 1T$ as of November 20212.
The massive adoption and market growth have been accompanied by price volatility. Bitcoin’s volatility usually fluctuates between 60% and 110%; its index peaked at 160% on August 22nd of 20213.
Several questions have risen around BTC price and its volatility. The one we are tackling in this article is ”What are the determinants of BTC price?”
The existing research literature has focused on three types of determinants: market forces such as supply and demand as traditional determinants of stan- dard money price, technological determinants such as Bitcoin Mining difficulty and Miners revenue, and macroeconomic determinants such as monetary pol- icy. In this article, we will re-examine these elements while also incorporating new ones that have not been covered in earlier works in the aim of identifying BTC/USD price drivers.
2 Methodology
Our study spans more than a decade, from July 19, 2010, through October 5, 2022. We first study the BTC/USD price determinants over the full period then we focused our analyses on the period after march 2020 as the market became more mature with the rise of decentralized finance.
We examined two categories of factors impacting BTC/USD price: internal and external ones.
We define internal factors being factors that are linked to the bitcoin blockchain and BTC activity: Hash-rate, Miners difficulty, Miners revenue, Transactions fees, Circulating supply, Number of active addresses in the network and trading volume.
External factors can be seen as macroeconomic and financial factors: GOLD, S&P 500, DXY, DowJones, DJIA, Fed rate, inflation, Stock-to-flow, USD/EUR and USD/CNY.
For our analysis, we used the vector autoregression (VAR) model that is a mul- tivariate system of regressions that can be used to capture rich dynamics of time series. The system proposes that a variable can be (at least partly) explained by its own lagged values and the lagged values of other variables in an intercon- nected multivariate system.
Moreover, we used Granger causality test in order to establish the causality relationship and its extent between Bitcoin’s price and the factors previously discussed.
Additionally, we applied a shock to our model and used the impulse response function. After a shock in a specific instant, an impulse-response function ex- plains the evolution of the variable of interest over a specified time horizon. To put it another way, impulse response functions track the dynamic influence of a shock or change in an input on a system. This is used once a model has been developed to see how the outcomes vary in response to external changes.
After our VAR model has been fitted, we used the forecast error variance de- composition (FEVD) to assess how much information each variable in the auto regression provides to the other variables. It calculates how much of each vari- able’s prediction error variation may be explained by external shocks to the other variables.
3 Results
3.1 From 2010 to 2022
We started by looking at the correlation matrix (see Figure 3) between the considered factors and BTC price. Figure 3 illustrates that Miners difficulty, DowJones, Nasdaq, Hash-rate and Yuan had almost perfectly positive linear correlation with BTC; the lowest correlations were the Fed rates and gold. The other factors studied ranged between - 0.2 to 0.47 having no perfectly positive or negative linear correlation with BTC.
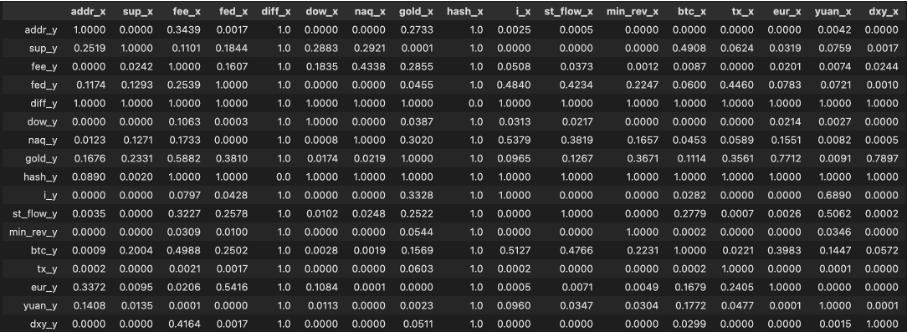
From the Granger-causality test (see figure 3), we found that the majority of factors had no or reciprocal Granger-causality with BTC. The number of active addresses, Nasdaq, Dow Jones and Transaction rate all have a reciprocated Granger-causality with BTC.
As for the impulse response test, we only saw responses for two factors, Miners difficulty and Hash-rate. The results of the forecast error variance decomposition indicates that Transaction rate, Nasdaq and Dow Jones are responsible for 85% of the BTC price variation.
3.2 From 2020 to 2022
The correlation matrix (see figure 5) now shows that there is a high correlation between DowJones, NASDAQ and Yuan and Miners revenue. The correlation between BTC and Difficulty and Hash rate decreased to 0.27 and 0.29 respec- tively.
As for the Granger Causality test (see figure 6), we find that currencies: Yuan, Euro, DXY granger causes BTC price. We also find that BTC Granger-causes the number of active addresses, Stock-to-flow, Miners revenue and the Transac- tion Hash.
We did not witness any change in the results of the impulse response test with only two parameters, Miners difficulty and Hash-rate, elicited answers. Similarly, we also obtained the same results with the FEVD graph. According to FEVD values, Transaction rate, Nasdaq and Dow Jones are responsible for 85% of the BTC price variation.
4 Concluding Remarks
From the conducted analyses, and for the period 2010-2022, the factors that were found to have an impact on BTC price were some internal factors such as the number of active addresses and the transaction rate, and then some external factors such as the Nasdaq and Dow Jones. Afterwards, from 2020 to 2022, the BTC price was mostly influenced by external factors, traditional macro economic index indicators such as the NASDAQ, Dow Jones, EURO and DXY. Therefore, we can come to the conclusion that BTC price is becoming less and less affected by internal factors and more with external ones.
We also observed that the correlation structure changed as we divide our periods into intervals; does this mean that the nature of BTC relationship with these factors will evolve? Does this correlation deter the appeal of BTC as a ”safe haven”?
These questions will be tackled in an upcoming study.
https://blog.chainalysis.com/reports/2022-global-crypto-adoption-index/
https://coinmarketcap.com/currencies/bitcoin/
https://studio.glassnode.com/metrics?a=BTC&category=&m=indicators.Bvin


